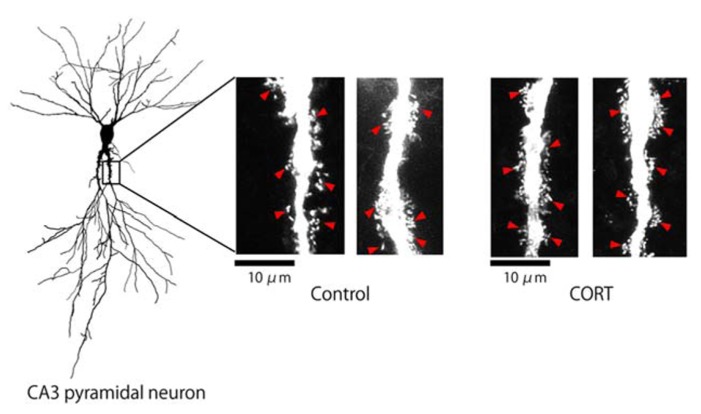
FIGURE 1.
Changes in the density of thorns by CORT in hippocampal slices. Maximal intensity projections onto XY plane from z-series confocal micrographs, showing thorns along the primary dendrites of hippocampal CA3 pyramidal neurons. Left image shows a traced whole image of Lucifer Yellow-injected CA3 neuron. Right images show thorns (red arrowheads) without drug-treatments (Control) or thorns after 1 μM CORT treatments (CORT) for 1 h. Bar 10 μm.

