
Figure 3.
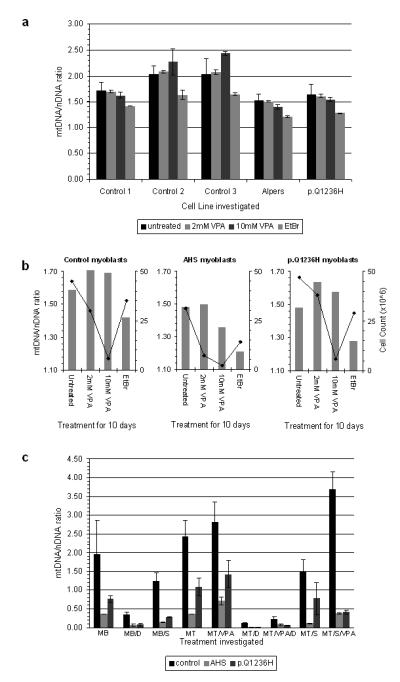
(a) Ratio of mtDNA to nuclear DNA for each cell line following ten days of treatment with either 2mM VPA, 10mM VPA, 50ng/ml Ethidium bromide (EtBr) or untreated. AHS = p.A467T/p.K1191N compound heterozygote. (b) Relationship between mtDNA level and cell viability after ten days of treatment. For comparison, mtDNA ratios (mtDNA/nDNA) are represented as columns on the left hand y-axis and cell count (×106) as a line plot on the right hand y-axis. VPA = sodium valproate. EtBr = ethidium bromide. AHS = p.A467T/p.K1191N compound heterozygote. (c) Ratio of mtDNA to nuclear DNA for each myotube cell line following 9 days of treatment with/without 300 μM didanosine (D) or stavudine (S) and additionally with/without 10mM VPA. MB= myoblasts, MT=myotubes, AHS = p.A467T/p.K1191N compound heterozygote. VPA = sodium valproate. Error bars = SD in all panels.