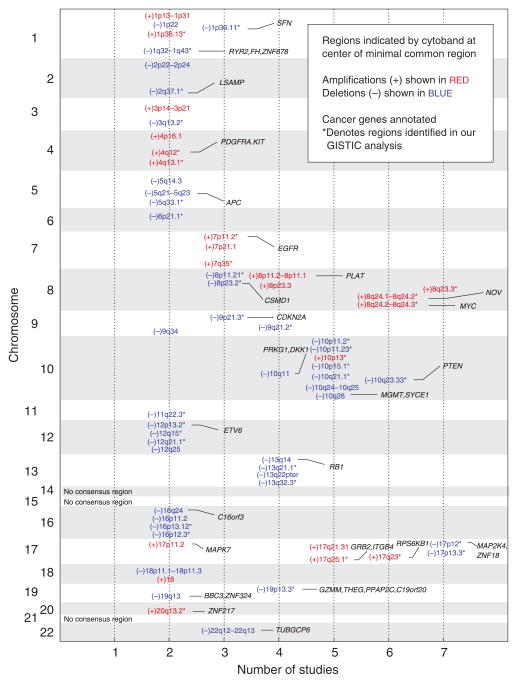
Figure 2. Consensus analysis of the leukemic cutaneous T-cell lymphoma (CTCL) genome.
Analyzing seven CTCL genomic studies (Mao et al., 2002, 2003; Fischer et al., 2004; Vermeer et al., 2008; Caprini et al., 2009; Laharanne et al., 2010), including our own, common regions of amplification (shown in red) and deletion (shown in blue) were defined by at least two studies and the minimal common region was determined by at least one study. The first column indicates the chromosome number. The second column indicates the number of studies including the minimal common region. Cancer-related genes from Beroukhim et al. (2010) are shown in the final column.

