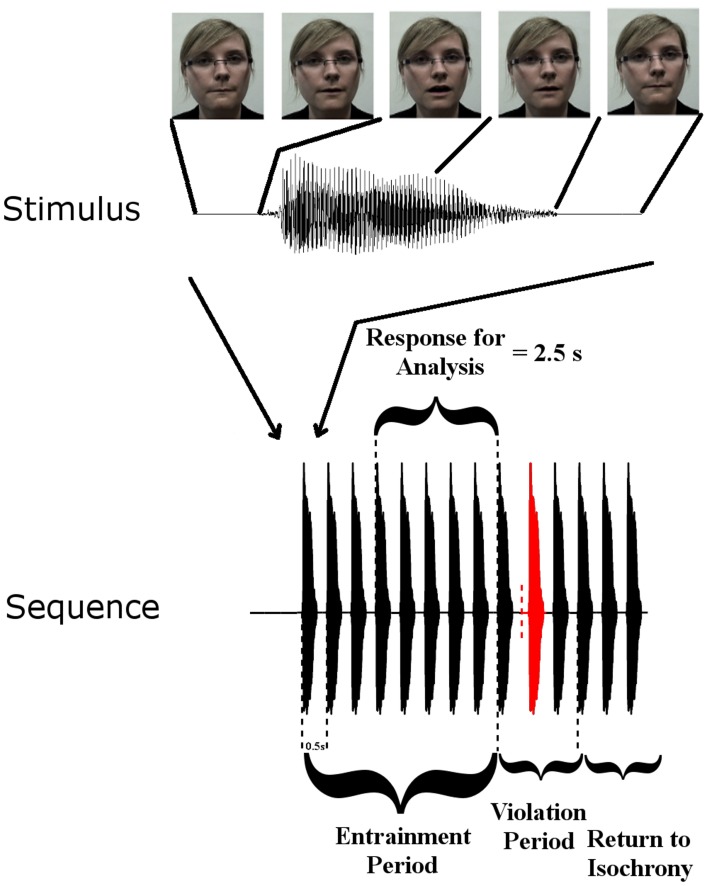
Figure 1.
Stimulus Setup: top panel shows one auditory “Ba” token and corresponding frames of the visual stimulus at five time points. Visual movement initiates 68 ms before auditory onset. The lower panel shows a stimulus sequence consisting of the entrainment period with SOA of 500 ms, and the violation period where SOA is disrupted, followed by 3 re-entrainment stimuli (“Return to Isochrony”). The red stimulus is the violator, whose position in the violation period is chosen at random (i.e., either the first, second, or third stimulus can violate the rhythm). The vertical dashed red line indicates where the stimulus would have onset if it had adhered to the isochronous stimulation rate. Also shown is the “Response for Analysis” period over which EEG responses were analyzed.

