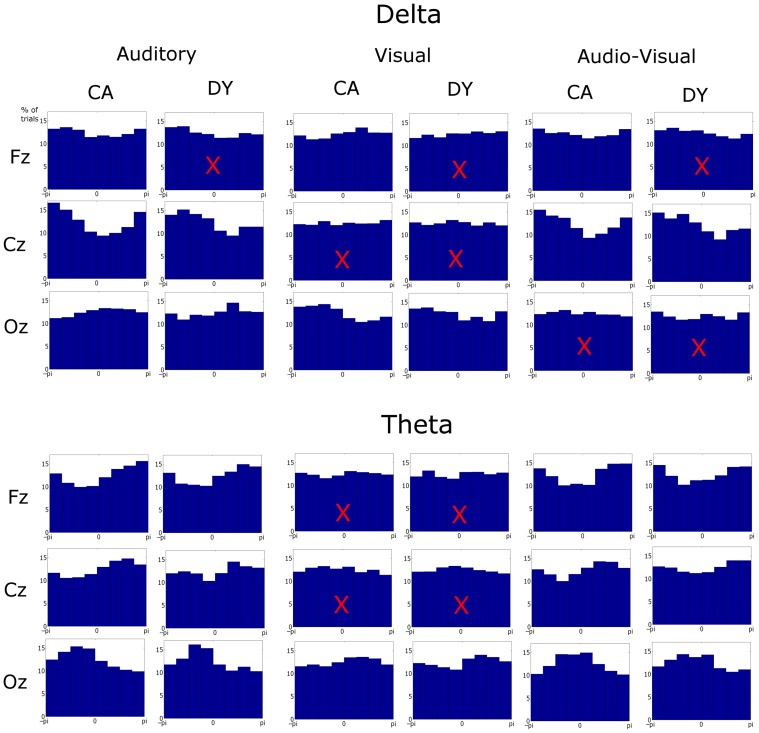
Figure 3.
Phase distributions at stimulus onset at representative frontal, central, and occipital electrodes in each condition, frequency band, and group. The x-axis is phase ranging from −π to π and y-axis represents the percentage of trials. Most distributions differed from uniformity when tested against the Rayleigh statistic at a critical p-value of 0.001. Distributions with a superimposed X did not result in significant entrainment.

