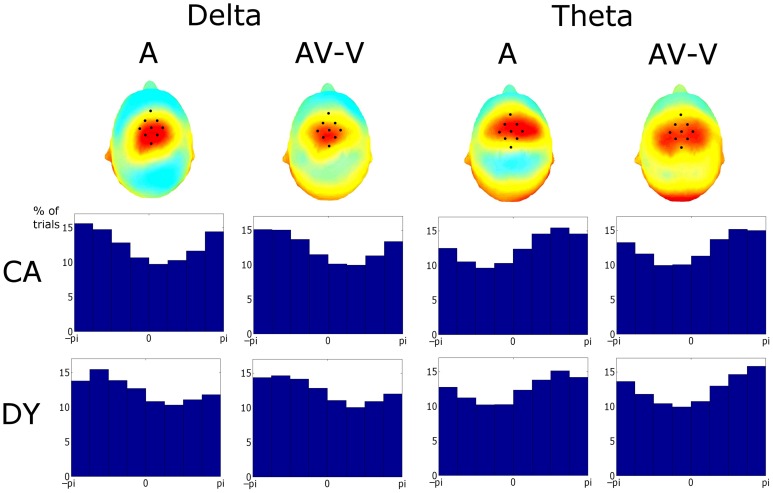
Figure 7.
Upper Panel: Topographies of the ITC for phase at stimulus onset. The similarity of these topographies established a particular fronto-central region of interest coinciding with the area of strongest entrainment. Lower Panel: phase distributions for the conditions and frequency bands in the region of interest (ROI). Activity in the ROI showed significant entrainment, as tested using the Rayleigh statistic, in both frequency bands and for both response types and both groups. Tests on the preferred phase of entrainment showed that auditory delta phase differed between groups. Auditory theta phase differed between conditions and was thus affected by visual cues.

