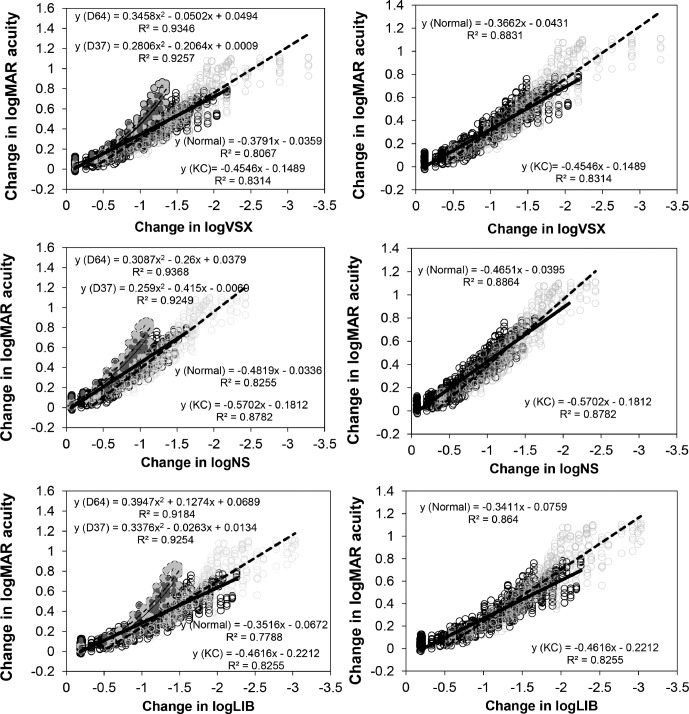
Figure 4.
Δ logMAR acuity as a function of Δ in three best correlating metrics: log visual Strehl ratio (VSX), log neural sharpness (NS), and log light in the bucket (LIB). Each data point represents the mean acuity obtained on three chart readings for each subject. The black/grey open circles represent the data points for charts convolved with normal/KC WFE, respectively. The thick solid/dashed lines represent the best-fitting lines to the logMAR acuities obtained with the normal/KC WFE, respectively. The dark and light grey filled symbols represent the data for two normal WFEs (D64 and D37) that behaved differently. These data are fitted with polynomial equations. The left column shows the data and fits for all 22 WFEs (15 normal and seven KC), and the right column represents the same data set, excluding two WFEs (D64 and D37).

