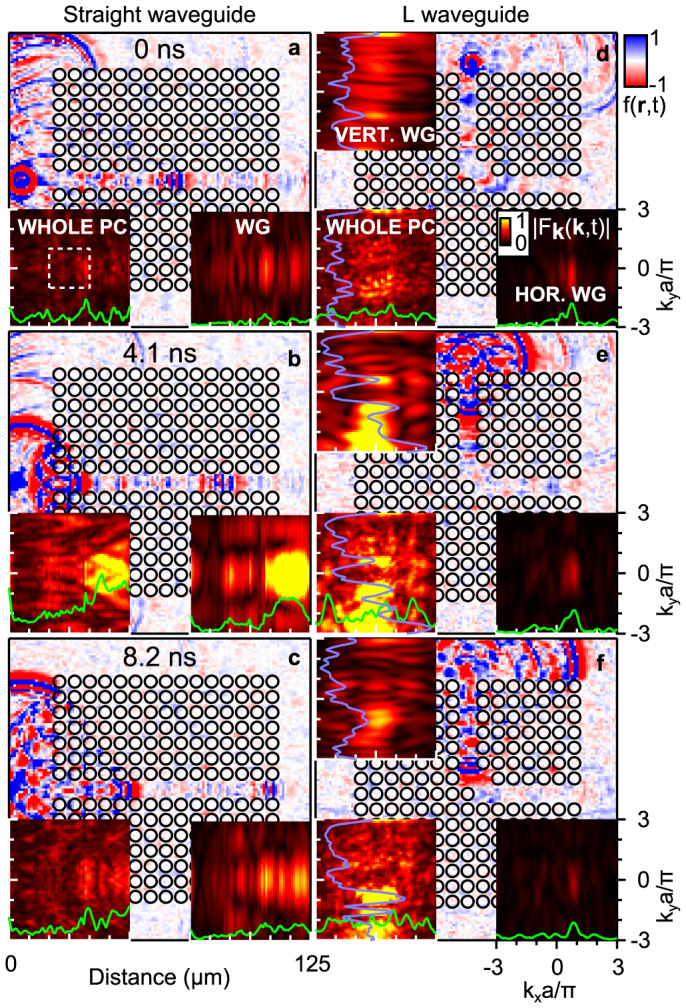
Figure 2. Wavepacket evolution in real space and k-space.

(a)–(c) and (d)–(f): real-time acoustic-field images for the straight and L waveguides (WG), respectively, at 4.1 ns intervals. Insets: 2D k-t-space representation for the whole PC region and for the waveguide region(s). The scales for the different times are identical for each type of plot. The scales for the vertical and horizontal sections of the L waveguide are also identical. The horizontal curves are ky = 0 sections through the centre of the guide and, for the L waveguide, the vertical curves are equivalent kx = 0 sections. The white square in (a) shows the 1st Brillouin zone.
