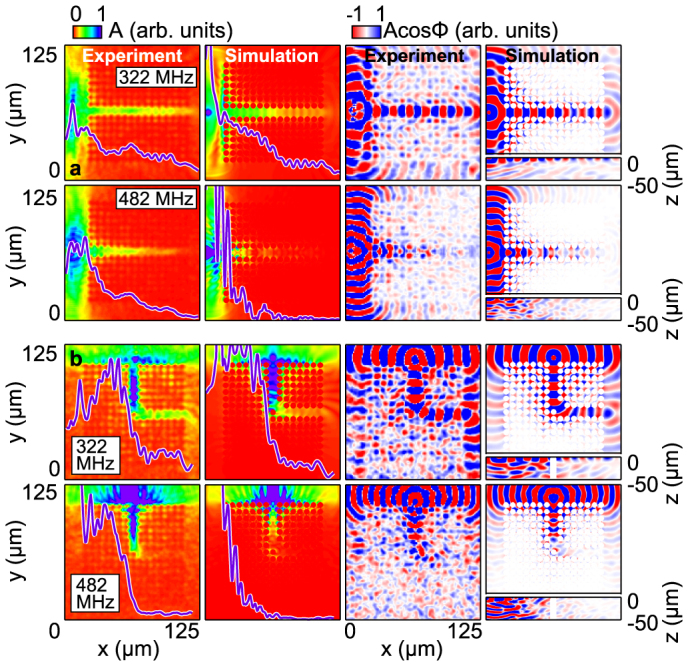
Figure 3. Frequency-filtered images.

r-ω space results. (a) Straight waveguide at 322 MHz (row 1) and 482 MHz (row 2). Columns 1 and 2: maps of the experimental and simulated A = |Fω(r, ω)|, together with sections (vertical curves) through the centre of the waveguide. Columns 3 and 4: A cos ϕ. Column 4 includes cross sections in a vertical plane running through the waveguide centres. Both the simulation and experimental data are normalized, with identical scales at the two frequencies in each case. (b) The same for the L waveguide. Cross sections are based on lines or planes though the centre of the waveguide.
