
Figure 4. Dispersion, decay constant, transmission and temporal evolution of eigenstate amplitude.
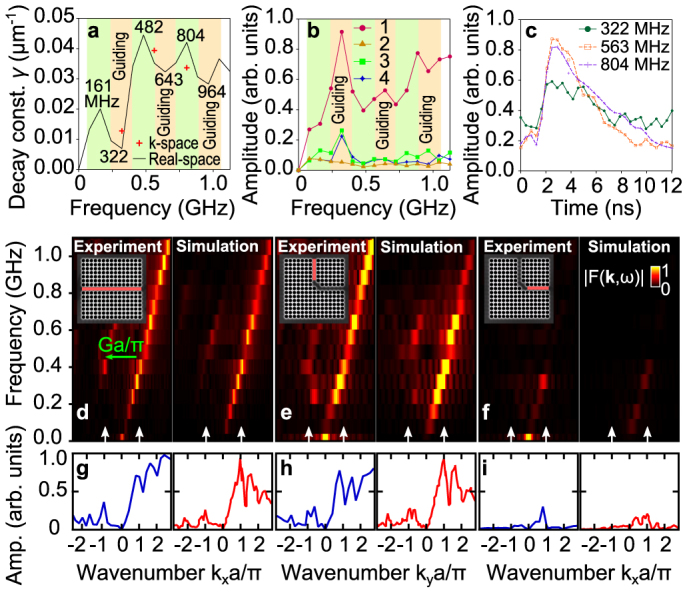
(a) Experimental frequency dependence of  inside the straight waveguide. The red crosses are fitted values from (c). (b) Point-by-point analysis of the acoustic frequency spectrum in the L waveguide for amplitude A = |Fω(r, ω)|. (c) k-space temporal evolution of the eigenstate amplitude in the straight waveguide. (d)–(f) Experimental and simulated dispersion relations from |F(k, ω)| for (d) straight waveguide, and (e), (f) L waveguide (plotted on the same scale). The insets show the analysis regions. Upward pointing white arrows: 1st Brillouin zone. (g)–(i) Profiles of |F(k, ω)| taken along the dispersion relation.