
Figure 7.
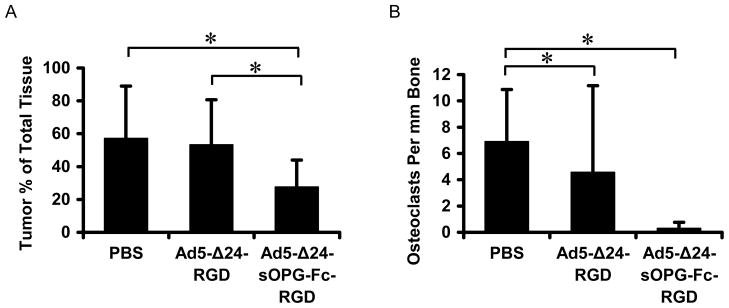
Histomorphometric analysis of stained tissue sections to measure tumor burden (A) and osteoclast formation (B). Shown are group means ± SD, n = 4 (PBS), 5 (Ad-Δ24RGD) and 6 (Ad-Δ24-sOPG-Fc-RGD), *Significant difference, P < 0.05, by Wilcoxon two-sample analysis. Tissue samples were harvested 10 days after treatment.