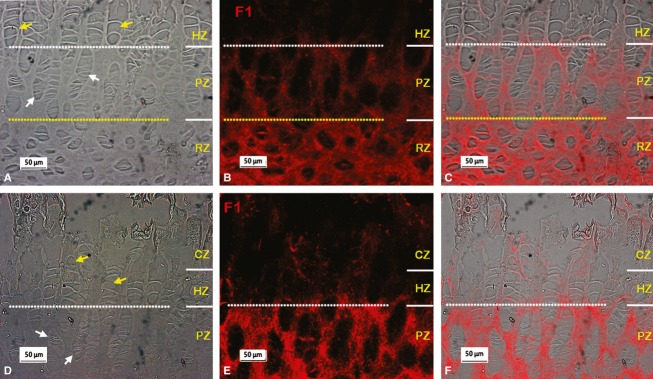
Fig. 5.

Typical fibrillin-1 (F1) microfibril organisation in the vertebral growth plate. A,B and D,E are micrographs took from the same sites respectively. (A,D) Phase contrast images showing the organisation of cells in the vertebral growth plate; hypertrophic and proliferative zone cells are highlighted with yellow and white arrows respectively. (B,E) Immunostained fibrillin-1 images from the identical areas of A and D respectively, showing extensive fibrillin-1 staining in the resting zone (RZ) and relatively more F1 staining in the proliferative zone (PZ) than that in the hypertrophic zone (HZ). CZ, calcified region of the hypertrophic zone.
