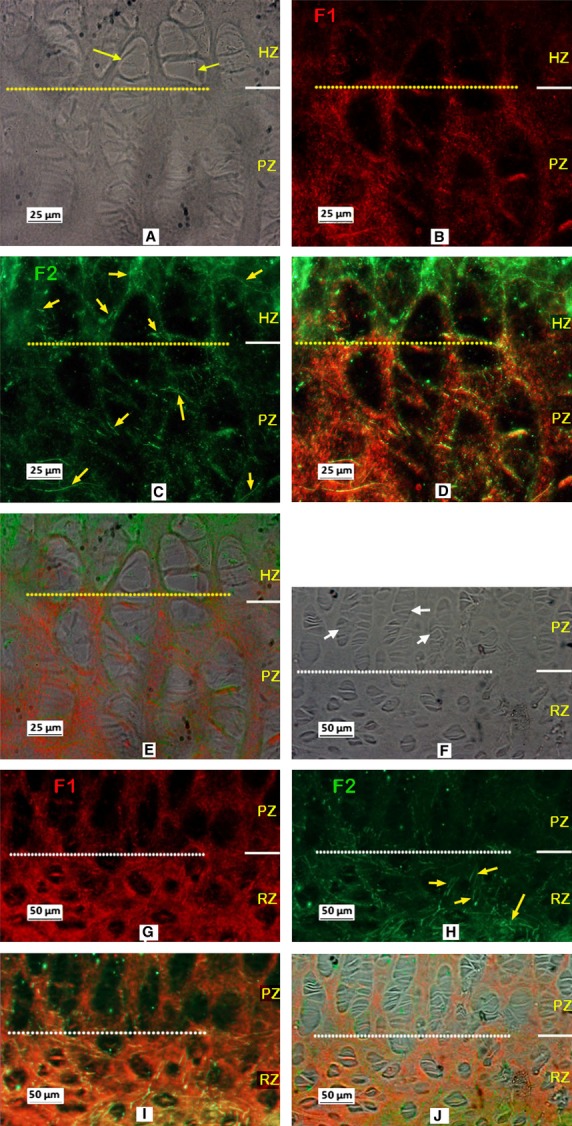
Fig. 7.

Typical dual-immunostained fibrillin-1 (F1; red) and fibrillin-2 (F2; green) in the vertebral growth plate. A to C, E to G are micrographs are took from the same site of a section respectively. (A,E) Under phase contrast, white and yellow arrows indicating the typical proliferating and hypertrophy cells respectively. B,C and F,G are the micrographs of dual-immunostained fibrillin-1 and fibrillin-2 respectively, showing F2 apparent in all three zones of the growth plate, highlighted with yellow arrows in C and G. (D,H) Merged image of B,C and F,G respectively showing relatively more fibrillin-2 in the HZ, and less in the PZ and RZ compared to fibrillin-1, the two highly colocalised otherwise. RZ, resting zone; PZ, proliferative zone; HZ, hypertrophic zone.
