
Figure 1.
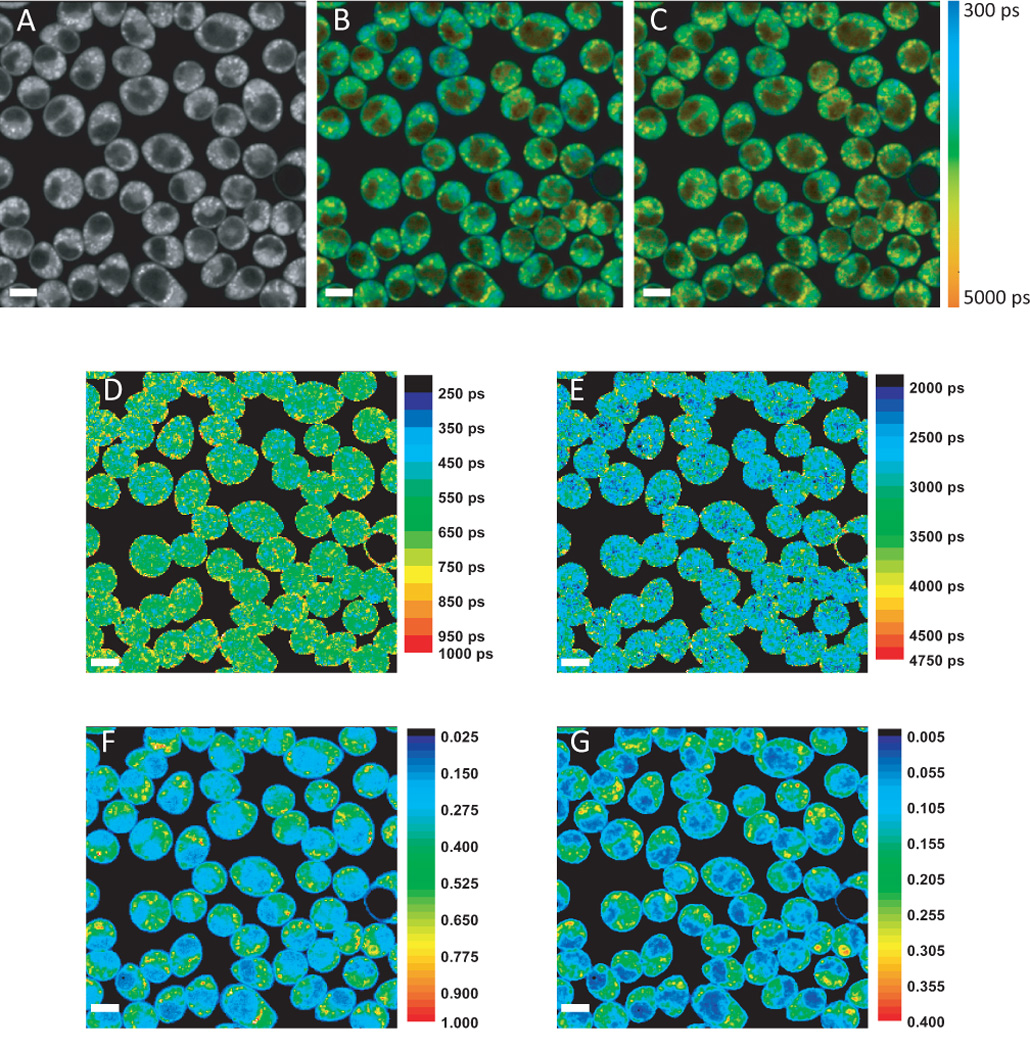
Metabolic FLIM analysis procedure to characterize intracellular NADH pools in cyanide-inhibited Rat Basophilic Leukemia cells.. A) NADH fluorescence intensity B) Intensity-weighted lifetime image with each pixel fit to a single-exponential decay (Eq. 2). C) Intensity-weighted effective lifetime image with each pixel fit by a double-exponential decay (Eq. 3). The pseuodocolor scale for A) and B) is shown at right. D) Short and E) long lifetime image maps (scale bar lifetimes in ps) and relative NADH concentrations associated with the short and long lifetime components as calculated by Eq. 8.