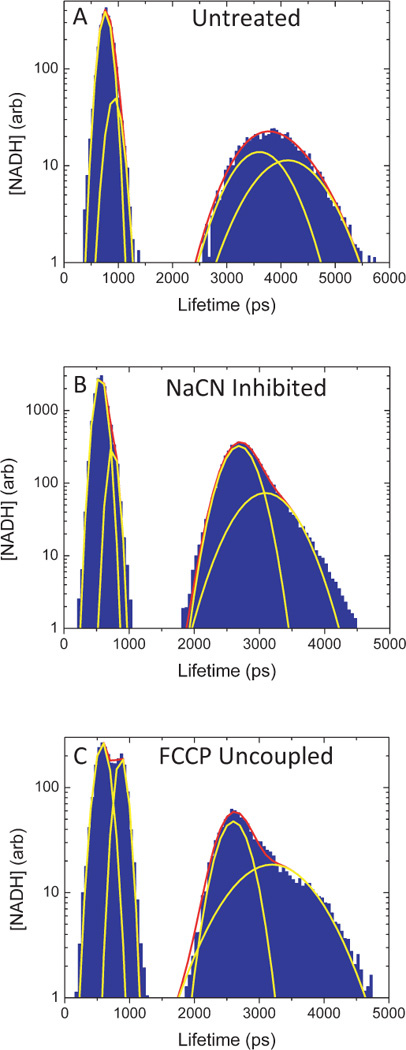
Figure 2.

NADH lifetime pixel histograms change with change in metabolic state. Sample FLIM analysis of RBL leukemia cells that was performed on A) normal, untreated cells, and metabolically B) inhibited, and C) uncoupled cells. Thin yellow lines show individual, Gaussian fits to the histogramed data, while the thick red line shows the sum of the individual fits. As shown in this figure, four Gaussians were sufficient to fit most datasets.
