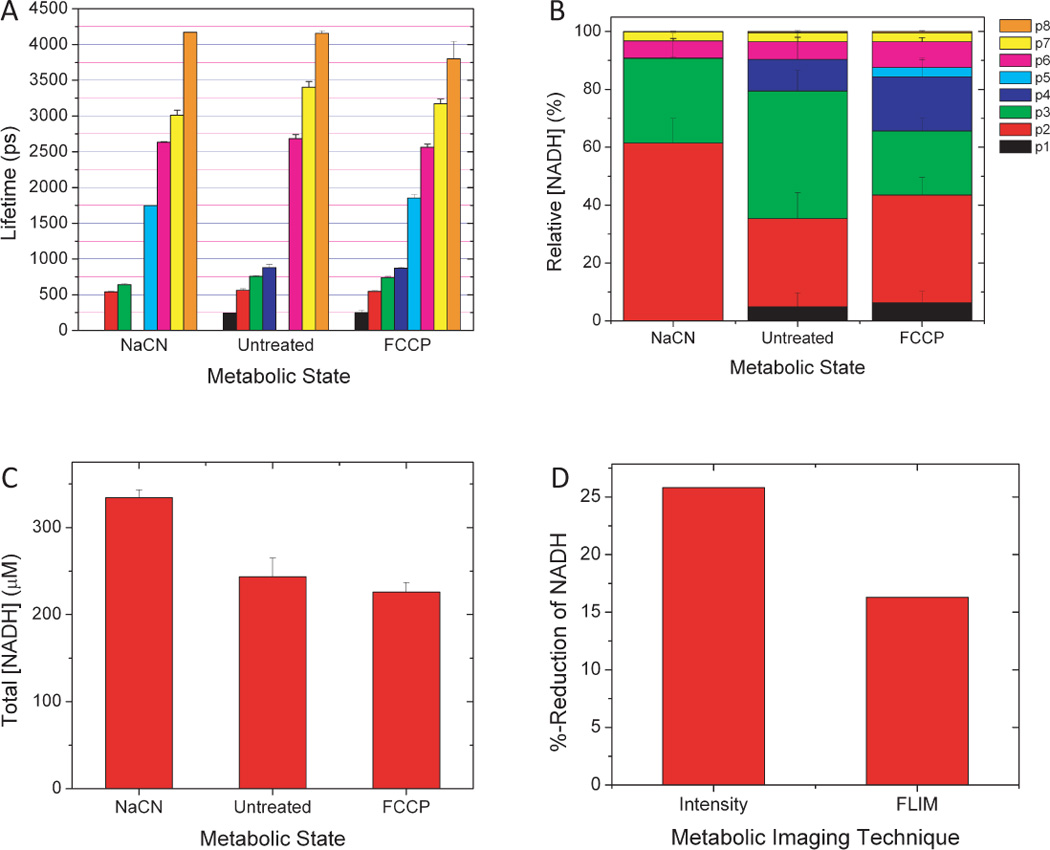
Figure 3.

NADH lifetimes (A), subpopulation concentration distributions (B), and total concentration (C) vary with metabolic state in RBL cells. Because NADH pool concentrations shift with metabolic state, the percent reduction of NADH is significantly overestimated by intensity imaging alone (D).
