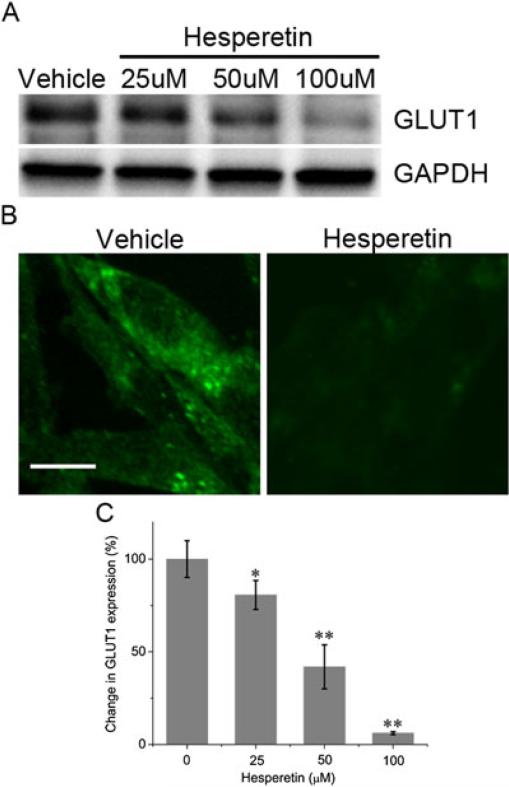
Figure 2.
GLUT1 expression in MDA-MB-231 cells treated with vehicle (0.1% DMSO) or hesperetin. (A) Western blot analysis of cells. (B) Confocal fluorescence microscope image of GLUT1 detected with fluorescent antibody (green). Scale bar: 20 μm. (C) GLUT1 mRNA expression. Results are expressed as the mean ±SE of the percent change in GLUT1.* P<0.05, ** P<0.01.

