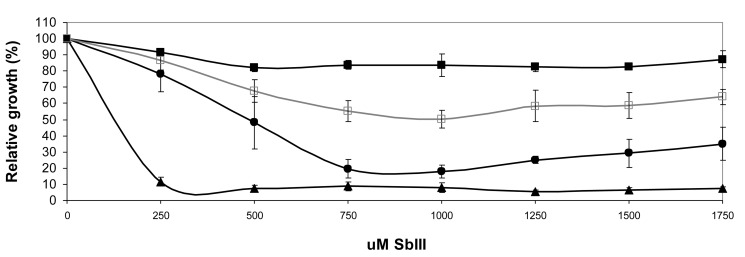
Figure 2. Antimony susceptibilities in Sb2000.1 and Sb2000.1REV transfected with LinJ.33.1810-WT.
Growth curves in the presence of increasing drug concentrations were performed by monitoring 72-hour cultures by OD measurement at 600 nm. The average of at least three independent experiments is shown. L.infantum WT (filled triangles); Sb2000.1 transfected with pSP72-αNEOα (filled squares); Sb2000.1 transfected with pSP72-αNEOα-LinJ.33.1810WT (open squares); Sb2000.1REV (filled circles).

