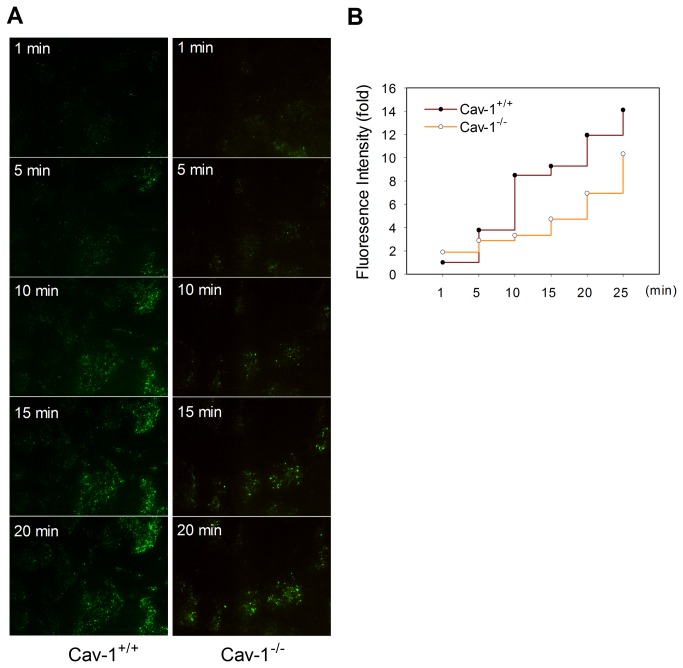
Figure 4. Dynamic process of Alexa488-BSA endocytosis in cav-1+/+ and cav-1-/- MLEC.
(A) Cav-1+/+ and cav-1-/- MLEC were serum starved for 4 h then incubated with Alexa488-BSA (50 µg/ml) in HBSS. Fluorescence signals were recorded from 0 min to 30 min under total internal reflection fluorescence (TIRF) microscopy. Images from indicated time points (1, 5, 10, 15 and 20 min) are shown. (B) Quantitative analyses of Alexa488-BSA uptake in cav-1+/+ and cav-1-/- MLEC were performed with MetaMorph software by measuring the fold change of fluorescence intensity compared to cav-1+/+ MLEC at 1 min after treatment.

