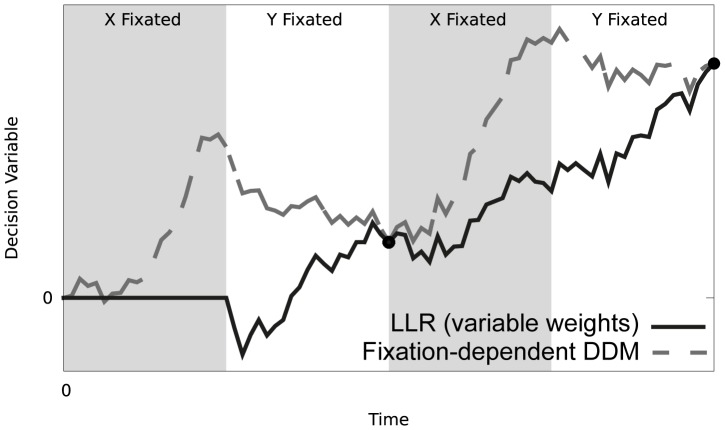
Figure 2. Temporal evolution of the log-likelihood ratio (Equation 5 – thick black line).
We also show a simplified decision variable described later in the text (dashed dark grey line; section ‘Fixation-dependent drift diffusion model’ in the Results). The decision variables were computed on the basis of identical sequences of sensory evidence generated from Gaussian distributions with means μx = 4 and μy = 1, and equal standard deviations σx = σy = 2.0. The sampling strategy used for both variables is identical and can be inferred from the background of the figure with grey indicating alternative X is fixated and white alternative Y, each block of fixation is equally sized. For easier comparison the simplified decision variable is scaled by c(1-q), where c is the scaling factor in front of square bracket in Equation 6. The simplified decision variable (Equation 10) in this example assumes time is allocated equally to the two sources ( ) and the points marked by black circles on the figure indicate the times when this assumption holds (
 ).
).

