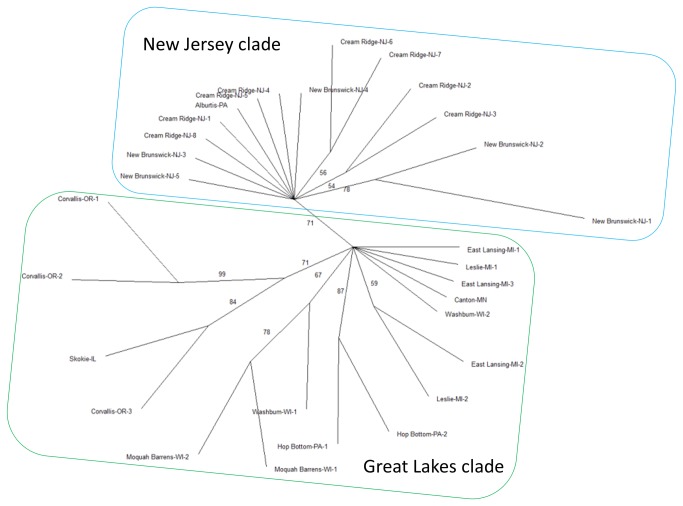
Figure 6. Consensus UPGMA tree of 30 Anisogramma anomala isolates characterized by 10 microsatellite loci.
Isolates are named by the city and state from where they were collected, and followed by a number if multiple isolates were obtained from the same location. Isolates were grouped into two clades in accordance with their geographic origins. UPGMA trees were generated by PowerMarker version 3.25 [36] using frequency-based genetic distance of shared alleles [39]. Consensus tree was computed from 100 bootstrap replicates using “consense” program in software package PHYLIP version 3.695 (http://evolution.genetics.washington.edu/phylip.html). Numbers by the branches are bootstrap support values in 100 replicates. Branches with less than 50% bootstrap support were collapsed.

