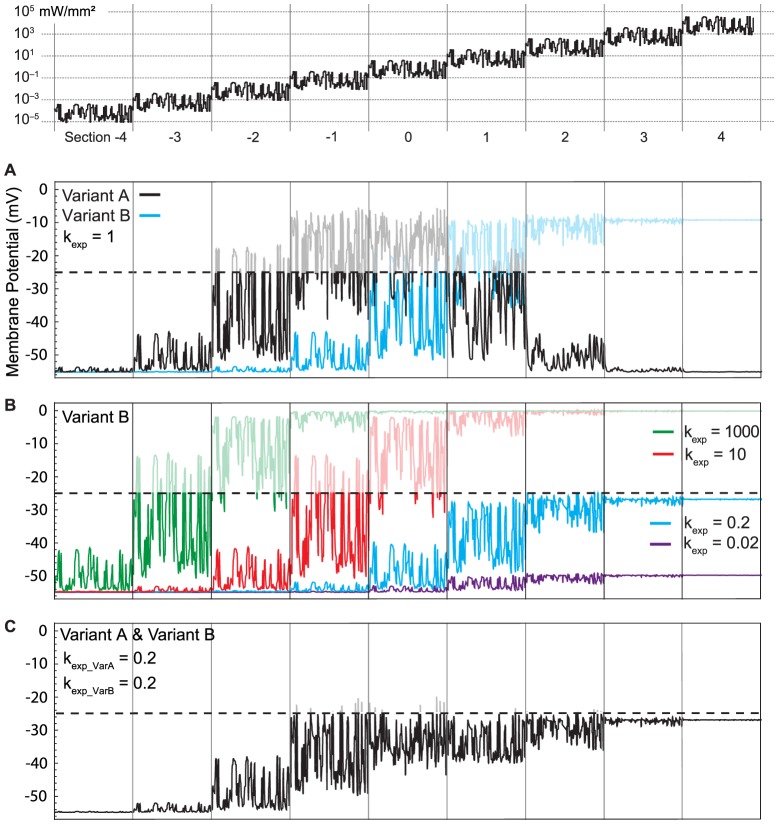
Figure 6. Membrane potential of cells expressing different ChR variants.
The light stimulus (top) was identical to Fig. 5. The current traces from Fig. 5 are translated into membrane voltage according to the membrane equation −C V’(t) = (V(t) − V rest)/R+k exp g ChR (V(t) − V reverse) with C = 6 pF, R = 5 GOhm, V rest = −55 mV, V reverse = 0 mV, and g ChR = (g 1 O 1+g 2 O 2). A: Membrane potential fluctuations caused by currents carried by Variant A (Fig. 5B) and Variant B (Fig. 5C). B: Effect of different expression levels k exp on membrane potential modulation. C: Expressing Variant A and Variant B together in a single cell, at moderate expression levels, leads to modulation of membrane potential over 7 orders of magnitude. In each panel, we show the hypothetical saturation level of the cell (−25 mV). Depolarization beyond this level is indicated by dimly printed voltage traces.

