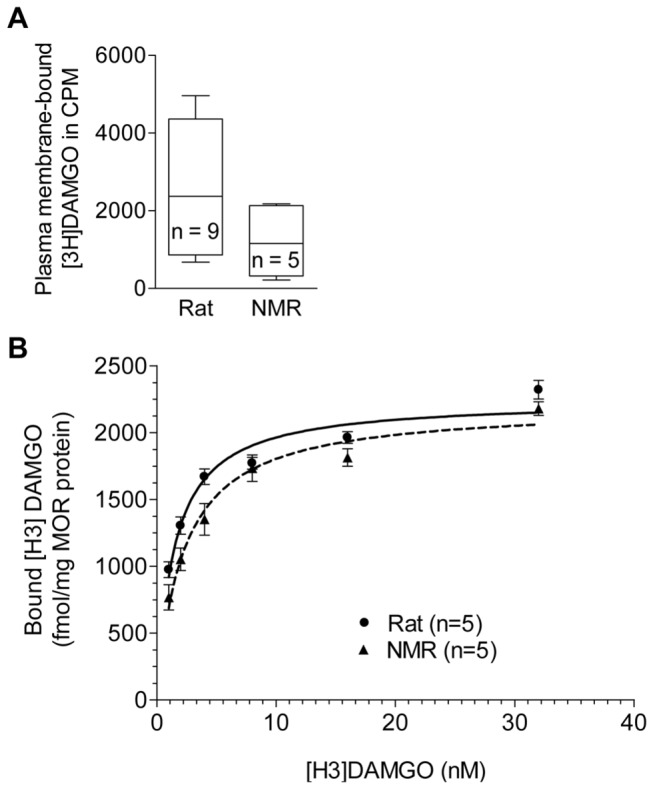
Figure 2. Radioligand binding of rat and NMR MOR.

A) [H3]DAMGO binding to plasma membrane extracts of rat and NMR MOR expressed in HEK293 cells (pCMV-oprm1-IRES-eGFP vector DNAs). Data are shown as whisker blots (min to max). B) Normalized [H3]DAMGO saturation binding curve of rat and NMR MOR expressed in HEK293 cells (pCMV-oprm1-IRES-eGFP vector DNAs) using whole membrane preparations. Data represent means ± SEM. Statistical analysis was performed using the two-tailed Mann Whitney U test.
