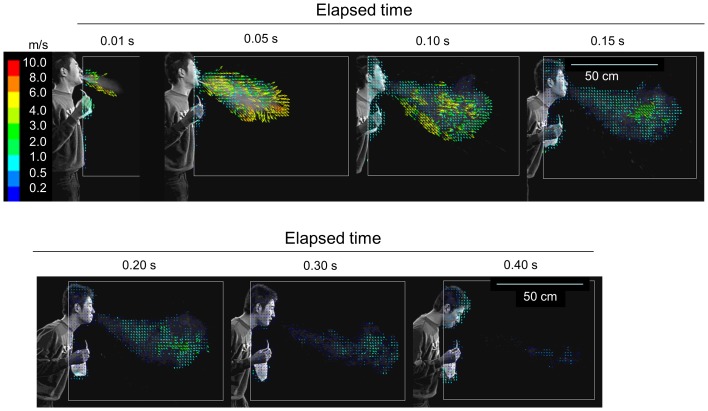
Figure 2. Vector analysis of particles movement in the sneeze.
The video image was converted to digital images collected every 1/300 s. Each brightness pattern of the aerosol particles or particle clusters, recognized as a particular granular signal, was automatically traced during 1/300 s using image processing software. The vectors are color graduated according to their velocity levels.

