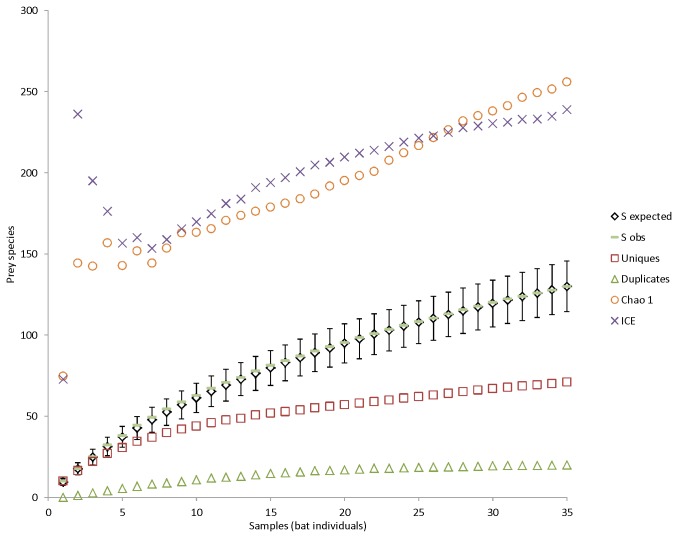
Figure 5. The prey species accumulation curve based on individual bat samples.
The y-axis shows number of samples (t) accumulated. Sexpected, expected number of prey species in t pooled samples with 95% confidence intervals. Sobs, observed number of prey species in t pooled samples. Uniques and duplicates, species observed only once or twice (respectively) in all the pooled samples. Chao1, incidence-based (presence/absence) non-parametric species richness estimator. ICE, Incidence coverage-based non-parametric species richness estimator. See text for references.

