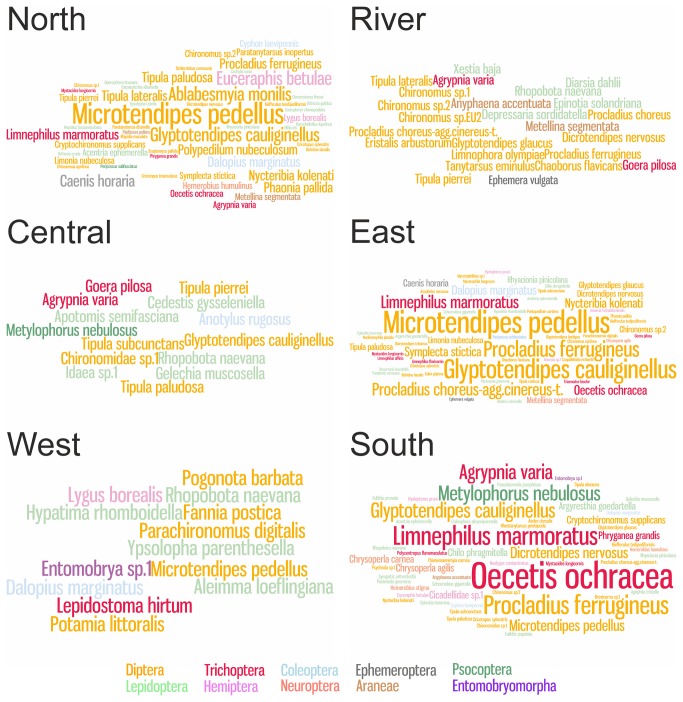
Figure 7. Daubenton’s bats prey species by frequency and taxonomic order.
Species identification cloud of prey species identified from Daubenton’s bats fecal DNA samples on six sampling regions. Font size represents the proportional occurrence of each prey species in all the samples sequenced. See Figure 1 for regions on the map.

