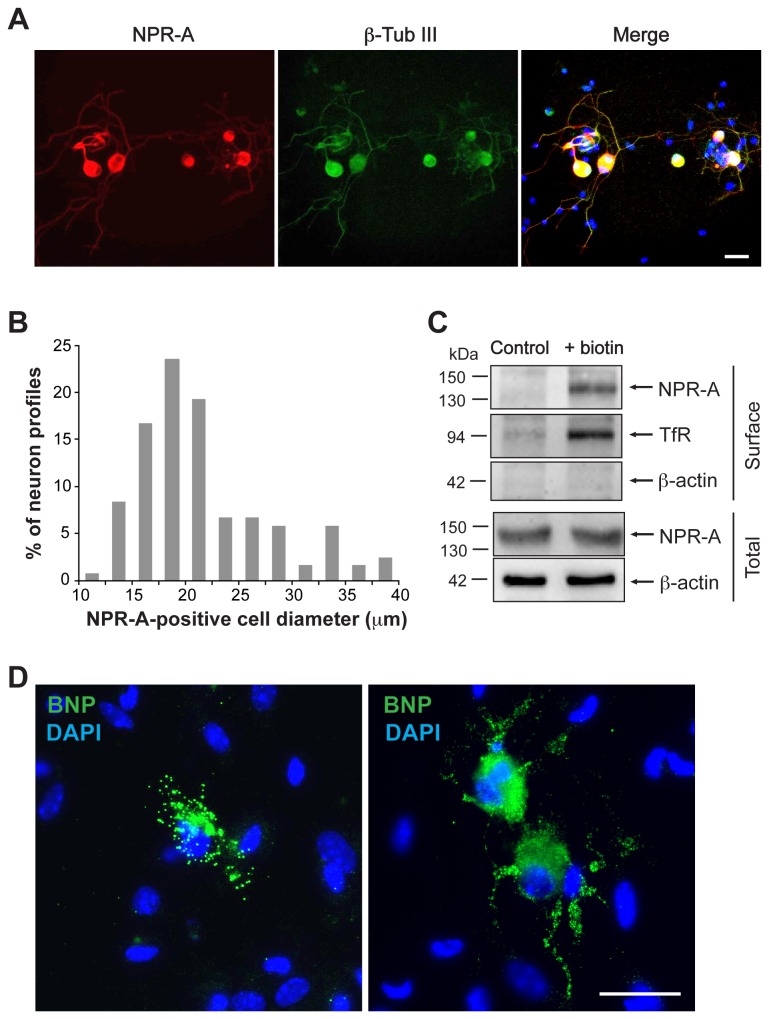
Figure 2. BNP and NPR-A are expressed in mouse TG cultures.
A, Immunocytochemical analysis of NPR-A (red) and β-tubulin (green) in mouse TG culture. Nuclei are visualized with DAPI (blue). Merge image (right) indicates extensive co-staining. Scale bar, 30 µm. B, Somatic size distribution of NPR-A-positive TG neurons. Data represent 119 NPR-A-positive neurons from 4 independent experiments. C, Example of Western immunoblotting (representative of three experiments) showing the surface (obtained after membrane biotinylation) and total expression of NPR-A in TG culture. β-Actin was used as loadingcontrol of the total extract. TfR is the marker for correct biotinylation. D, Immunostaining for BNP (green) is mostly restricted to few cells with non-neuronal morphology that display perinuclear immunoreactive granules (left panel). More rarely, some neuron-like cells are also stained for BNP with granules extending along their processes (right panel). Nuclei are visualized with DAPI staining (blue). Scale bar, 30 µm.

