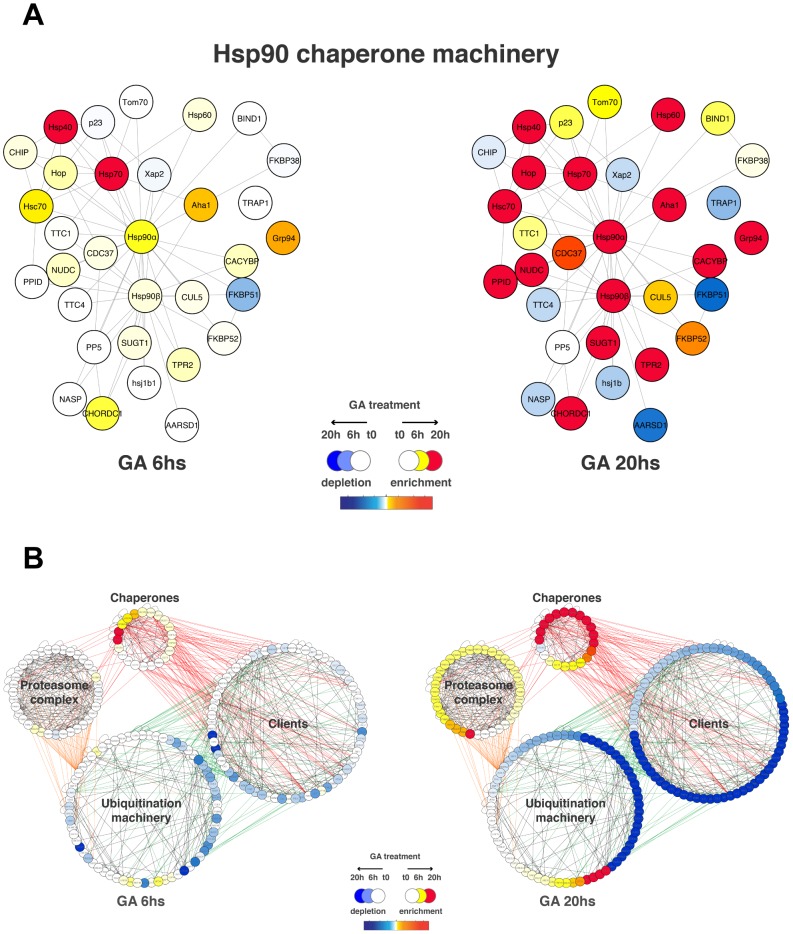
Figure 3. GA-induced remodeling of the Hsp90 chaperone and protein degradation machineries.
A) Components of the Hsp90 molecular chaperone machine (Hsp90Int, [21]) showing significant changes in the stSILAC data are schematized in a graph. Edges (lines) represent protein-protein interactions amongst members of the machinery. stSILAC data is integrated in the graph and represented as a colour gradient (red corresponds to enrichment, white is no change and blue is depletion) (see legend). B) GA-induced changes of the proteasomal/ubiquitination machinery with connected Hsp90 clients. Members of the proteasomal complexes, ubiquitination machinery, molecular chaperones and known or potential Hsp90 client proteins are interconnected by edges indicating protein-protein interactions. Relative levels of proteins at 6h and at 20h after GA treatment are integrated in the graph and represented as a colour gradient (red corresponds to enrichment, white is no change and blue is depletion) (see legend).

