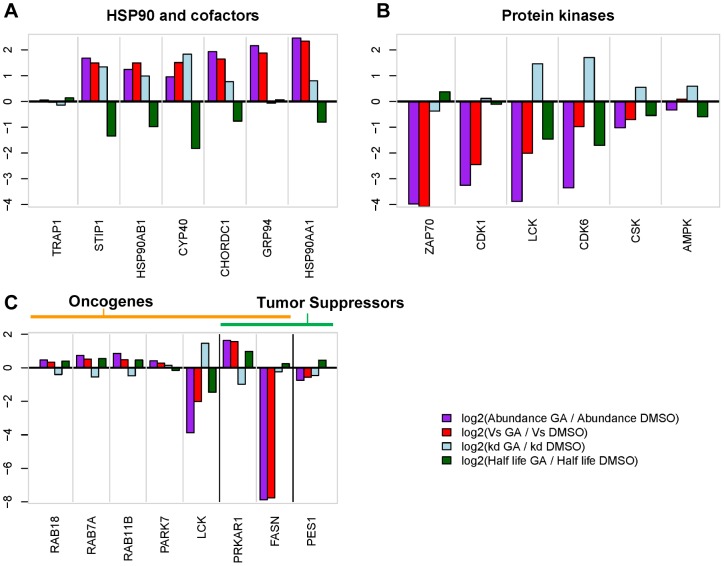
Figure 7. Relative changes in kinetic parameters upon GA treatment.
Relative changes in synthesis (log2 [Vs_GA/Vs_DMSO]), decay (log2 [kd_GA/kd_DMSO]), abundance (log2 [pGA/pDMSO]), and half-life, (log2 [T1/2_GA/T1/2_DMSO]) for selected proteins are represented in the respective plots according to the bar colour codes. Proteins were selected from the following categories: A) Hsp90 and cofactors B) Protein kinases and C) Tumour suppressors and oncogenes. As for Figure 6, all values are adjusted by the median of the entire proteome. PRKAR1 and FASN are annotated as both possible oncogenes and tumor suppressors [73].

