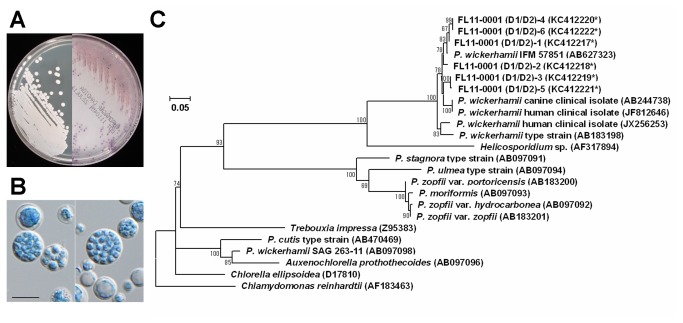
Figure 2. Characterization of the Prototheca clinical strain FL11-0001.
(a) Colony appearance of FL11-0001. Left and right panels show colonies grown on PDA at 25°C for 7 days and CAC at 35°C for 4 days, respectively. (b) Cellular morphology of FL11-0001. Scale bar corresponds to 10 μm. (c) Phylogenetic tree of the nucleotide sequences of LSU D1/D2 region. The GenBank accession number of each sequence is shown in the parenthesis, and the accession numbers with an asterisk indicate the new sequences determined in this study from cloned DNA. The evolutionary history was inferred by using the Maximum Likelihood method with the Tamura 3-parameter model [27] selected based on the BIC scores. Additionally, a discrete Gamma distribution was used to model evolutionary rate differences among sites, and the rate variation model allowed for some sites to be evolutionarily invariable. The tree with the highest log likelihood is drawn to scale, and the scale bar (0.05) is shown in the unit of base substitutions per site. The bootstrap values less than 50 are not shown. The outgroup is Chlamydomonas reinhardtii.

