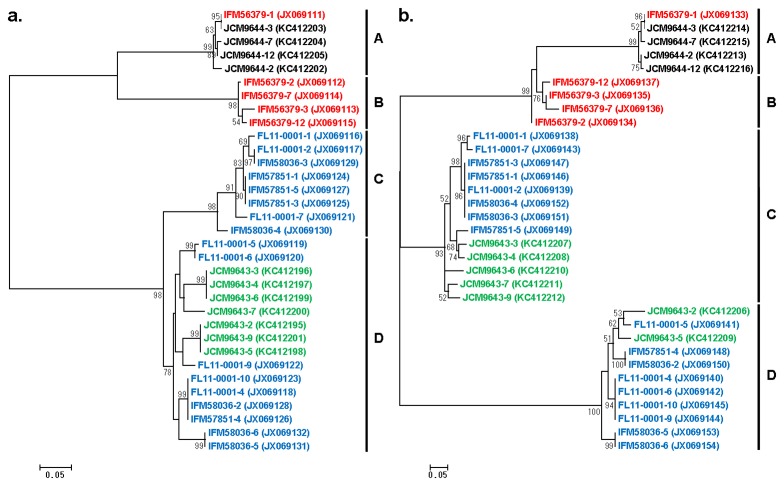
Figure 4. Unrooted phylogenetic trees of ITS1 and ITS2 sequences derived from various strains of P. wickerhamii.
The 400-bp sequences corresponding to the 5’ end of ITS1 (a) and the 3’ end of ITS2 (b) were determined in this study from cloned DNA, and their accession numbers are indicated in the parentheses. The evolutionary history was inferred by using the Maximum Likelihood method with the Hasegawa-Kishino-Yano model [28] selected based on the BIC scores. A discrete Gamma distribution was also used to model evolutionary rate differences among sites. The trees with the highest log likelihood are drawn to scale, and the scale bars (0.05) are shown in the unit of base substitutions per site. The bootstrap values less than 50 are not shown. Four sequence clades expediently designated as A through D are indicated. Red sequences are derived from the type strain isolated in U. S. A. Black, blue and green sequences are derived from clinical strains isolated in South Africa, Japan, and New Zealand, respectively.

