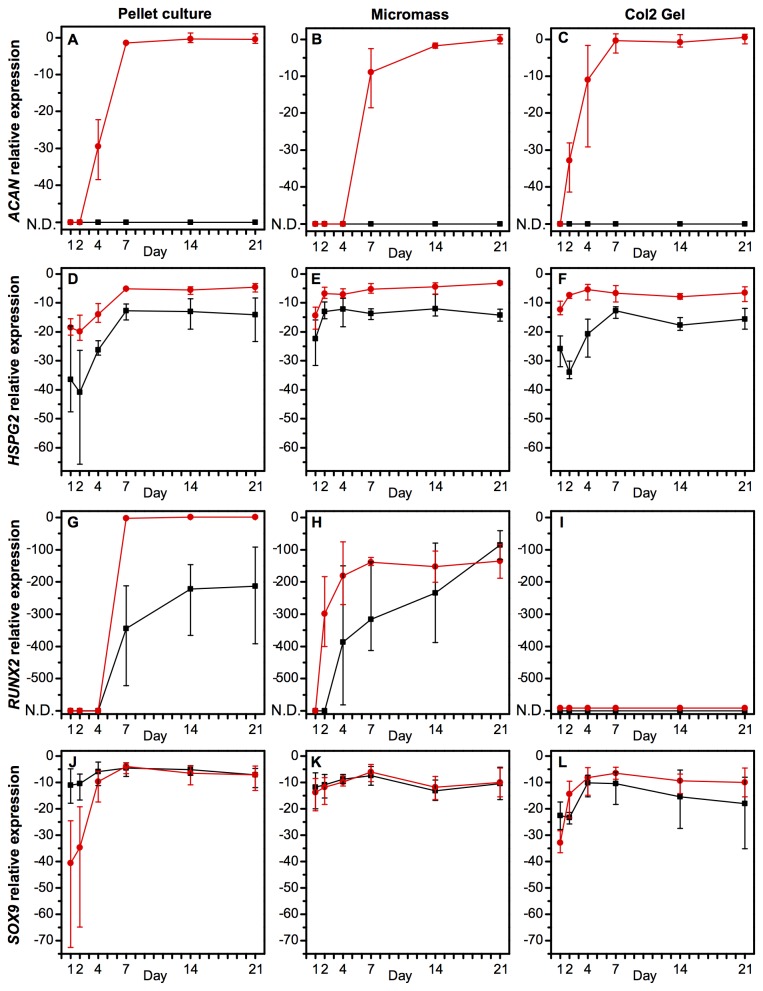
Figure 3. Quantitative PCR established mRNA expression in hMSCs in three different chondrogenesis models (pellet culture, micromass culture, or a type II collagen hydrogel) in either growth or chondrogenic medium over a time-course of 21 days.
A high expression of ACAN (A-C) and HSPG2 (D-F) are markers of a hyaline cartilage ECM and pericellular matrix, respectively. RUNX2 (G-I) and SOX9 (J-L) are markers of osteogenesis and chondrogenesis, respectively. Data are transcript expression relative to GAPDH as an internal control (N.D.: not detected). Black squares: hMSCs cultured in growth medium, red circles: hMSCs cultured in chondrogenic medium. Data are the mean values of N=3 independent experiments performed in technical triplicate. Error bars indicate the range of values. Statistical significance is shown in Figures S15-S16.

