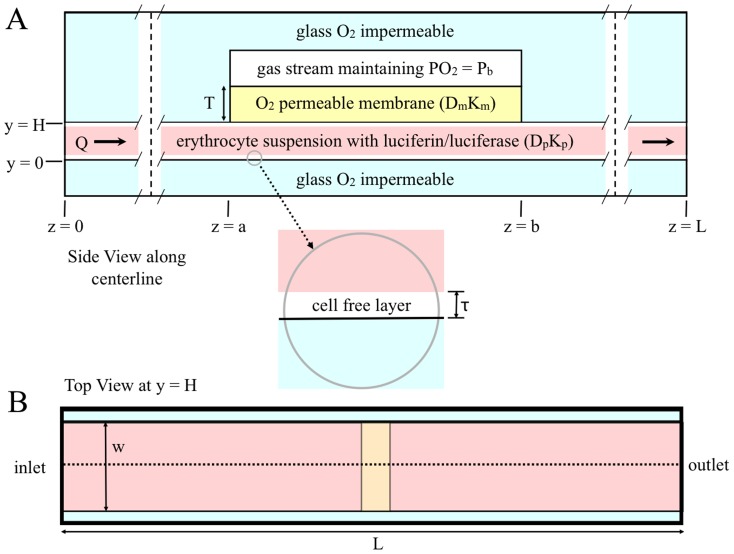
Figure 1. Two-dimensional representation of a microfluidic device for measuring oxygen-dependent ATP release from erythrocytes.
A. shows the side view along the centerline. This view of the diagram is to scale; the vertical dashed lines indicate where the diagram is broken to allow for the entire device to be shown. B. shows the top view; the dotted line indicates the centerline. Note: this view of the diagram is not to scale.

