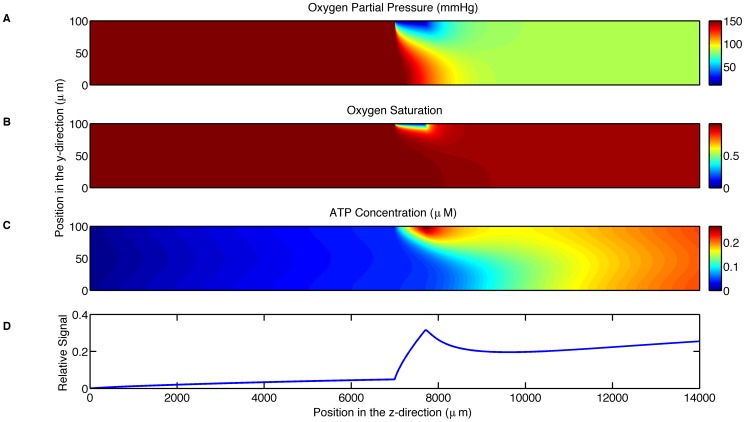
Figure 2. Shows the simulation results for the parameters in Table 1.
A. displays the oxygen partial pressure (mmHg) as a function of position (µm) throughout the microfluidic device. B. displays hemoglobin oxygen saturation as a function of position (µm) throughout the microfluidic device. C. displays the ATP concentration (µM) as a function of position (µm) throughout the microfluidic device. D. displays the relative output signal as a function of longitudinal position.

