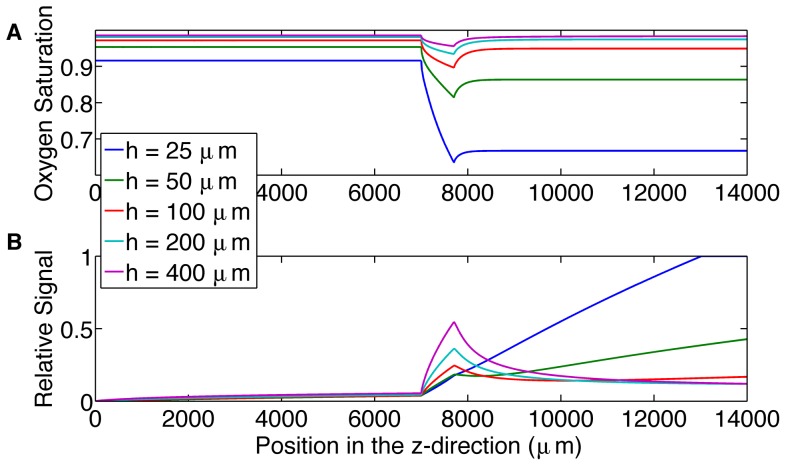
Figure 3. Shows the effect of increasing channel height.
A. displays the mean hemoglobin oxygen saturation across the channel as a function of position (µm) along the microfluidic device for channel heights of 25, 50, 100, 200 and 400 µm. B. displays the relative output signal as a function of position (µm) for channel heights of 25, 50, 100, 200 and 400 µm.

