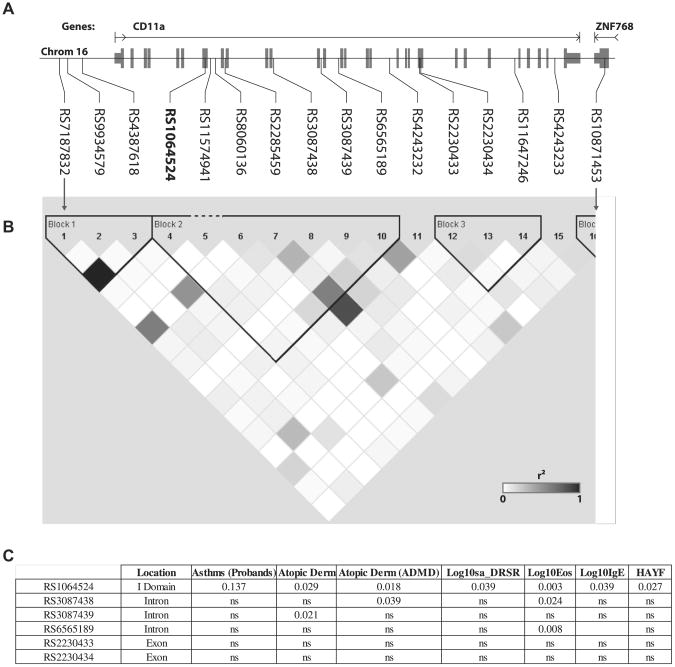
Fig 5.
Association of human CD11a SNPs to allergic disease. A, Location of SNPs within the human CD11a locus; exons are indicated in gray. B, Pairwise r2 values for correlations between identified SNPs. Black squares, r2 = 1; white squares, r2 = 0; gray squares, 0 < r2 < 1 with intensity proportional to r2. C, Significant correlations between SNPs and the indicated allergy phenotypes. DRSR, Log of dose-response slope to methacholine challenge; ns, not significant; HAYF, hay fever.

