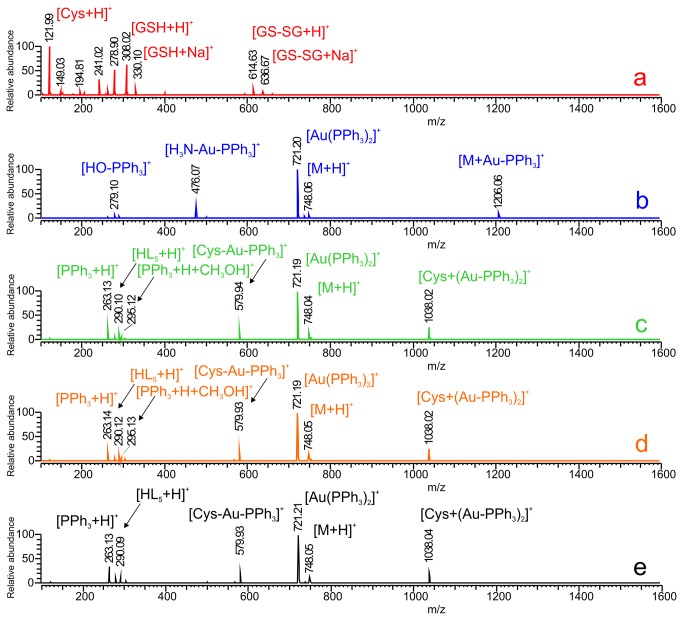
Figure 8. The ESI mass spectrometry analysis of interactions between the complex 5 and sulphur-containing biomolecules.
The mass spectrum of the mixture of physiological concentrations of cysteine (290 μM) and reduced glutathione (6 μM), (a); the mass spectrum of the solution of complex 5, (b); the mass spectrum of the interacting system containing the physiological concentrations of cysteine and reduced glutathione and 5, immediately after mixing, (c); the mass spectrum of the interacting system containing the physiological concentrations of cysteine and reduced glutathione and 5, 1 h after mixing, (d); the mass spectrum of the interacting system containing the physiological concentrations of cysteine and reduced glutathione and 5, 12 h after mixing, (e).

