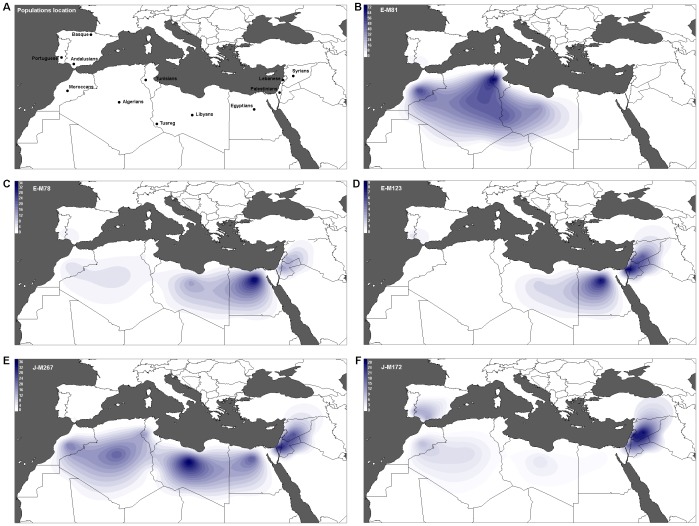
Figure 1. Frequency of the major Y-chromosome haplogroups in North Africa and surrounding regions.
Intensity of the colors reflects the frequency of a haplogroup in the studied populations. A) Location of the analyzed populations. B–F) Frequency distribution of haplogroups E-M81, E-M78, E-M123, J-M267, and J-M172 respectively.

