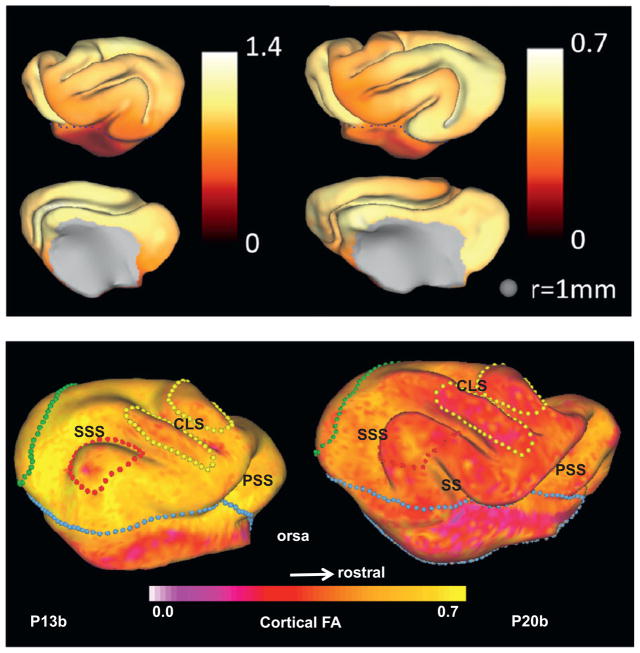
Fig. 5.
(a) Maps of local relative cortical growth, ΔA = (A2A1)/A1 from P14 to P21 (left) and P21 to P28 (right) in the left hemisphere of one ferret. While the isocortex expands at a roughly constant rate after about P13, relative cortical growth is larger from P14 to P21 because cortical growth represents the change in local surface area relative to the initial local surface area. Growth was not calculated on the medial wall, which is shown in gray. Reproduced with permission from Knutsen et al. (2012). (b) Regional variations of cortical fractional anisotropy (FA) in the developing ferret brain. FA decreases with age over the first postnatal month (Kroenke et al., 2009). Here, cortical FA is projected onto P13b and P20b ferret brain cortical surface models, respectively. Boundaries between important cortical regions are marked by color-coded spheres on each surface: the isocortical/allocortical boundary (light blue); primary visual cortex (green); auditory cortex (red) and somatosensory area (yellow). Adapted with permission from Kroenke et al. (2009). (For interpretation of the references to color in this figure legend, the reader is referred to the web version of this article.)

