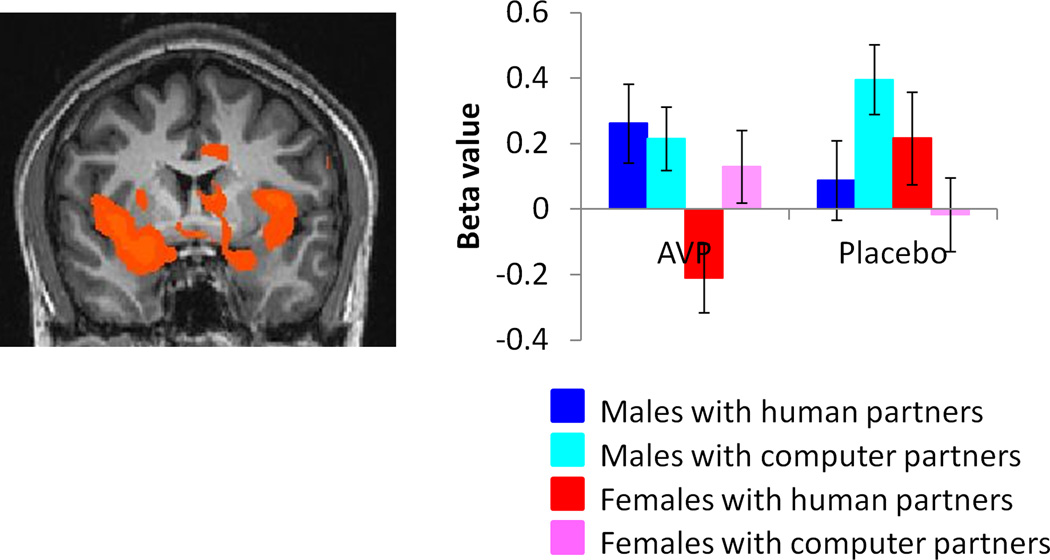
Figure 5.
Regions showing higher activation in males vs. females for the contrast [(CC human-CC computer) AVP- (CC human – CC computer)PL)], exclusively masked by the contrast [(CC computer)PL-(CC computer)AVP] male - [(CC computer)PL-(CC computer)AVP] female (p<0.05 corrected). Plotted beta values are averages over the entire extent of functional activation. Images are thresholded at p<0.05 corrected for multiple comparisons at the cluster level.

