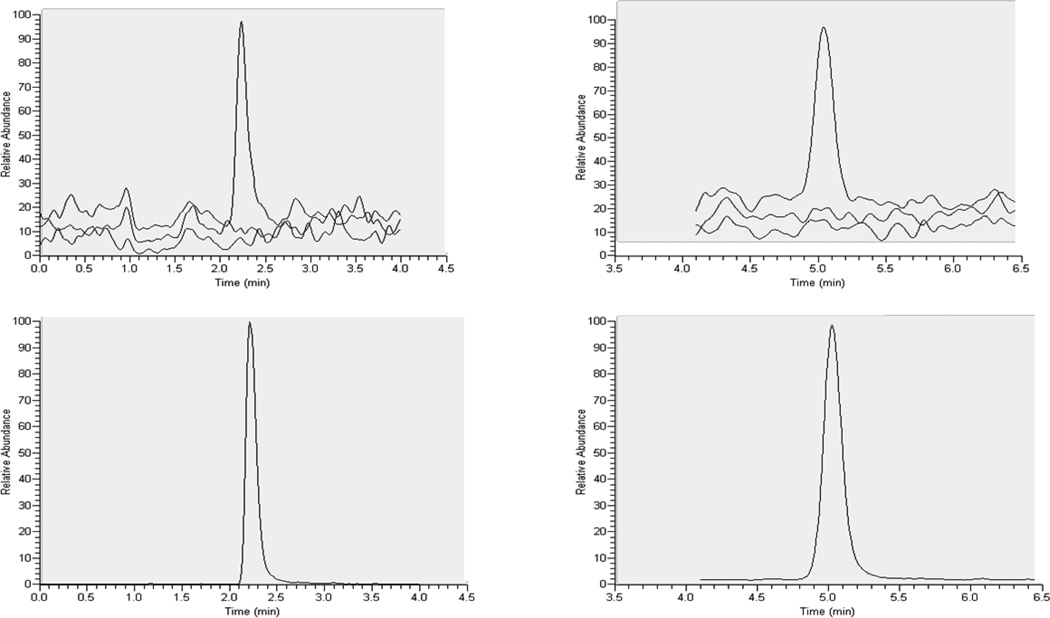
Figure 1.
Representative overlay of extracted DBS blank, DBS blank with internal standard and the lower limit of quantitation for TFV and FTC are in the upper left and right panels, respectively. The TFV and FTC retention times were approximately 2.2 and 5.0 minutes respectively. The y-axis was scaled to the lower limit of quantification response. The lower left and right panels represent the TFV-IS and FTC-IS signals, respectively.

