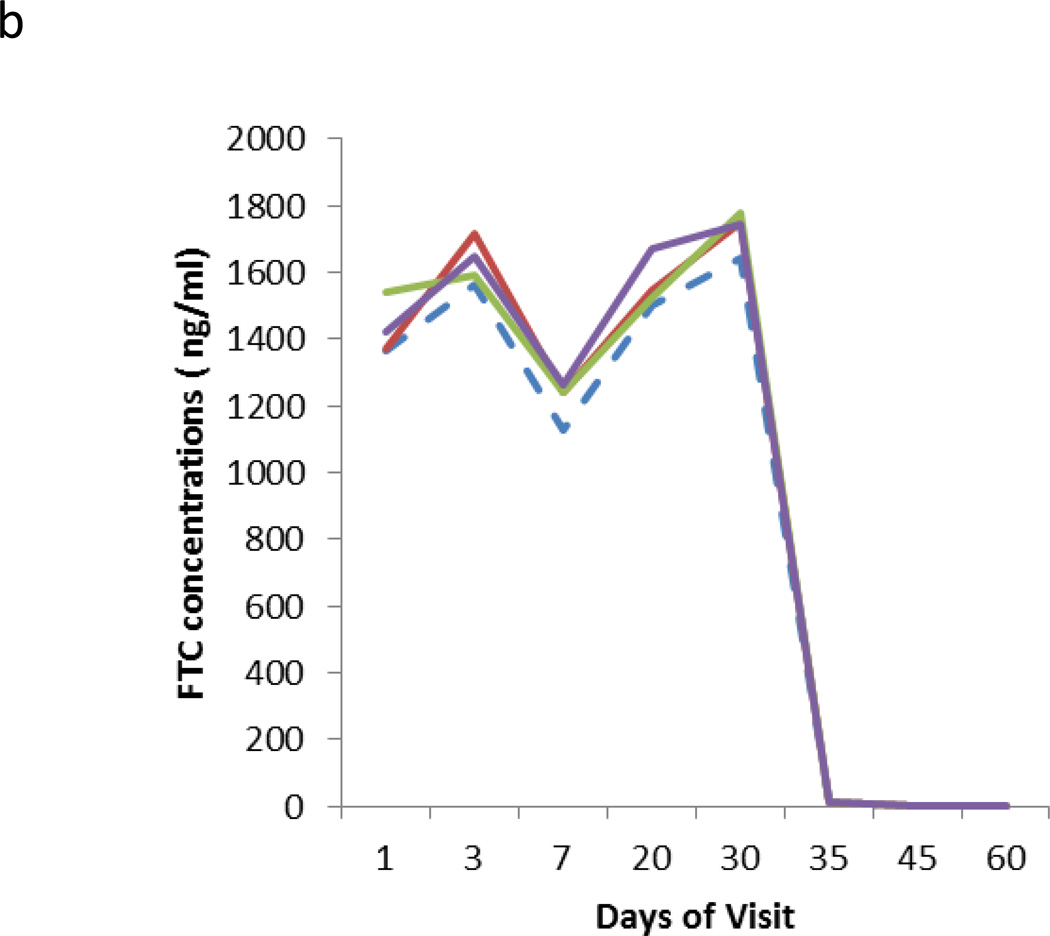
Figure 2.
Results from the different temperature storage stability of clinical samples. Four storage conditions were tested represented by a dashed line (RT) and solid lines (4°C, −20°C, −80°C). The Y axis represents the mean of measured concentrations at the different storage conditions of TFV (2a) and FTC (2b) from three subjects receiving 30 days of daily dosing followed by off-drug 30 days.


