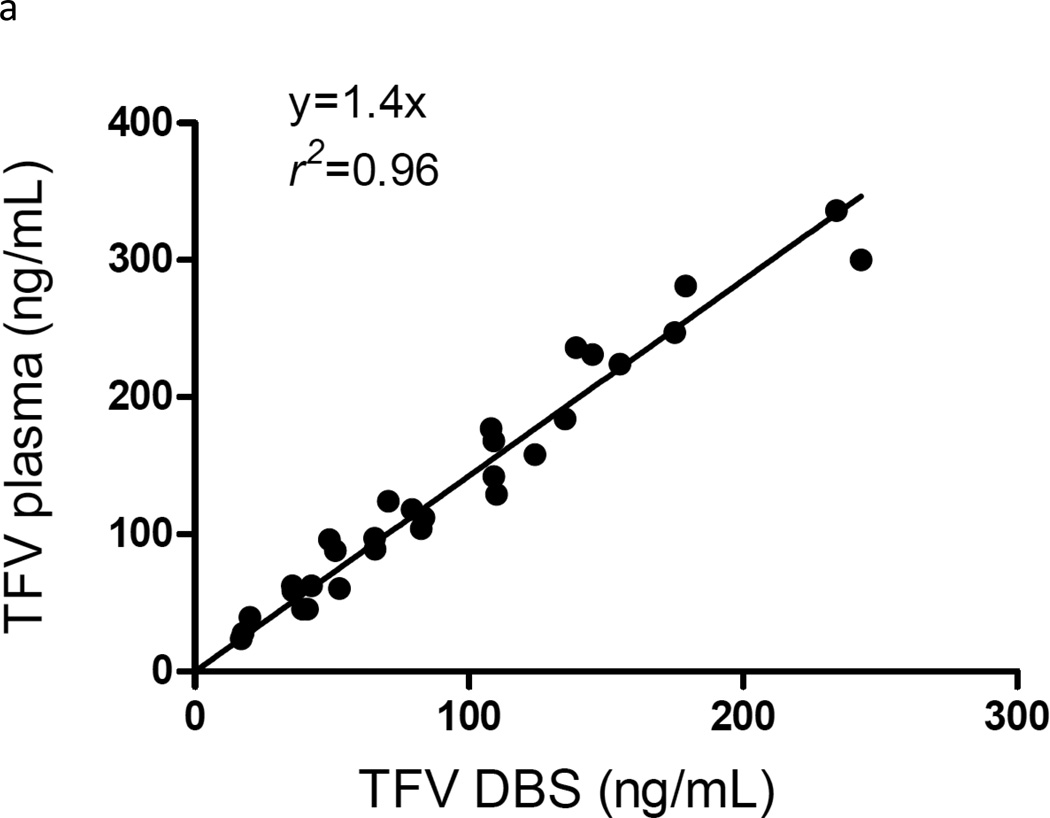
Figure 5.
DBS versus plasma from 2 intensive samplings (5 time points over 24 hours) in 3 subjects. One sampling was after the first dose and the other was after 30 days of daily dosing. TFV in DBS versus plasma (5a) and FTC in DBS versus plasma (5b) showed linear relationships defined by 1.4x, r2=0.96 for TFV and 0.8x, r2=0.99 for FTC. The regression did not account for repeated measures. Reprinted with permission from Castillo-Mancilla et al. AIDS Res Hum Retroviruses. 2013; 29(2):384–90.


