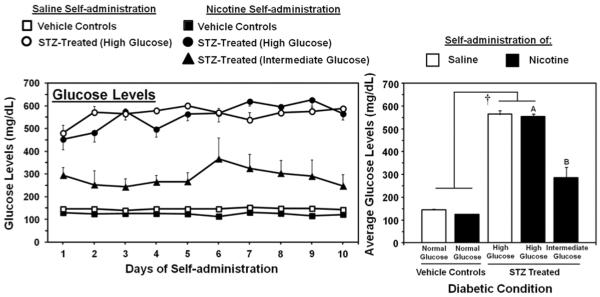
Figure 1.
Mean daily glucose levels (± SEM) during each day (left panel) and averaged across the 10 days of IVSA (right panel). The group numbers for saline IVSA rats were vehicle controls (n=6) and STZ-treated (high glucose; n=7). The group numbers for nicotine IVSA rats were vehicle controls (n=7), STZ-treated (high glucose; n=12), and STZ-treated (intermediate glucose; n=7). The dagger (†) denotes a significant effect of STZ treatment, the A symbol denotes significantly higher glucose levels as compared to all other nicotine IVSA groups and the B symbol denotes significantly higher glucose levels as compared to the vehicle-treated nicotine IVSA group (p < 0.05).

