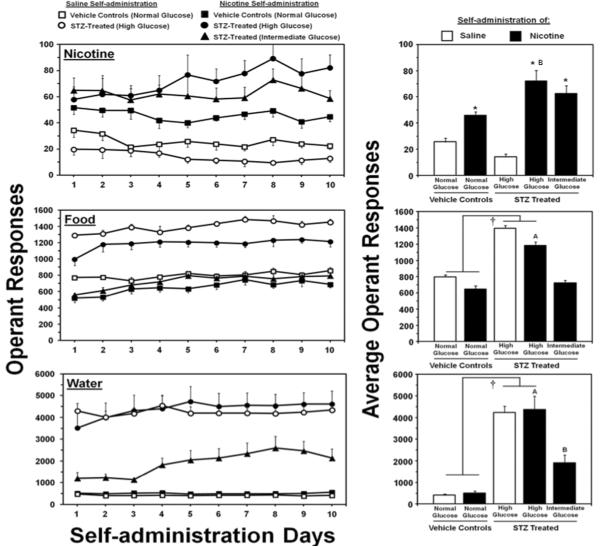
Figure 2.
Mean daily operant responses (± SEM) for nicotine or saline (top row), food pellets (middle row) or water deliveries (bottom row) during each day (left column) and averaged across the 10 days of IVSA (right column). The daggers (†) denote a main effect of STZ treatment, the asterisks (*) denotes a significant increase from saline IVSA rats, the letter symbol (A) denotes significantly higher intake as compared to all other nicotine IVSA groups, and the letter symbol (B) denotes higher intake as compared to the vehicle-treated nicotine IVSA group (p < 0.05).

