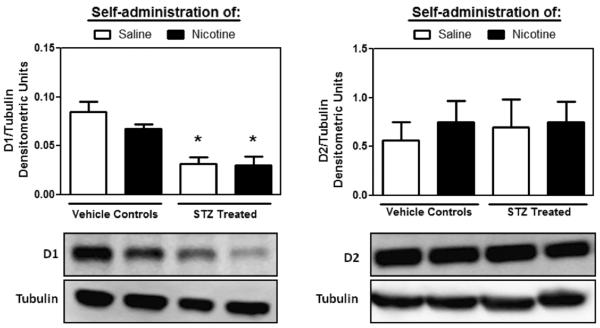
Figure 4.
Dopamine D1 (left panel) and D2 (right panel) receptor levels (±SEM) in STZ-treated and control rats following saline or nicotine IVSA. Tubulin was used as a loading control for each individual sample and was similar across all treatment groups. Asterisks (*) denote a significant difference from vehicle-treated controls that received saline IVSA (p<0.05).

