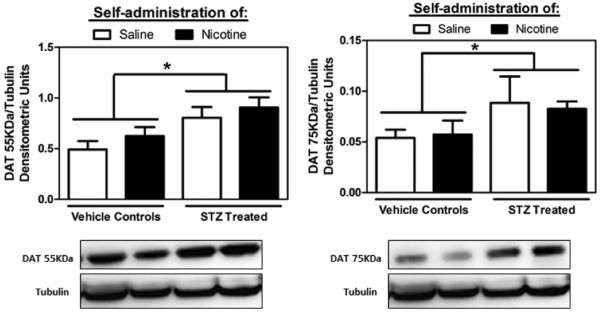
Figure 5.

Levels of cytoplasmic (55KDa; left panel) and membrane bound (75KDa; right panel) DAT (±SEM) in the NAc of STZ-treated and control rats following saline or nicotine IVSA. Tubulin levels were similar across all treatment groups. Asterisks (*) denote a main effect of STZ treatment, with STZ-treated rats displaying higher DAT levels regardless of IVSA condition (p<0.05).
