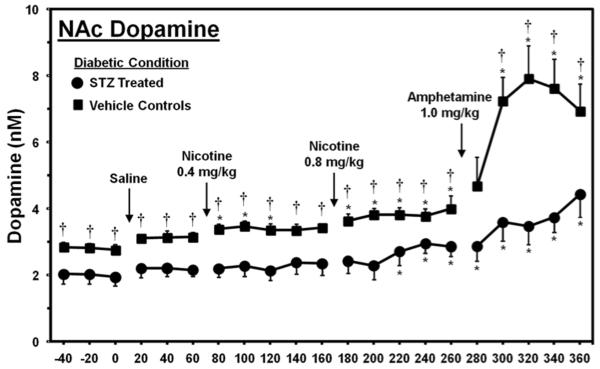
Figure 6.
Dopamine levels (nM± SEM) in the NAc of STZ-treated and control rats. The group numbers were controls (n=5) and STZ (n=6). Asterisks (*) denote a significant difference relative to baseline and daggers (†) reflect a significant difference between STZ- and vehicle-treated control rats (p < 0.05).

