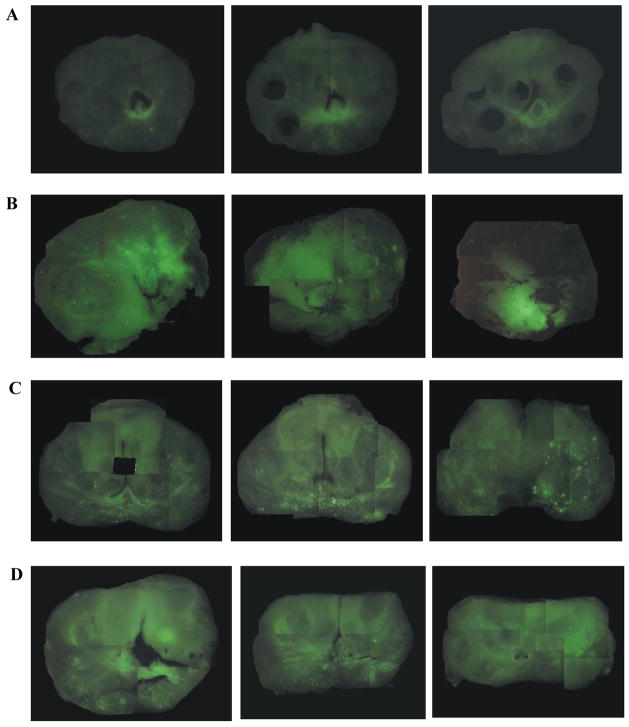
Figure 1. Fluorescently labeled adenoviral vector distribution analysis.
Adenoviral vector conjugated to isothiocyanate, a fluorescent marker, was injected into freshly resected prostates as described. Whole mount sections were visually analyzed using a fluorescent stereoscope. Representative examples from each of four conditions are shown above with three sections of each from apex to base shown from left to right. A) Control prostate without vector injection; note slight background fluorescence. B) Prostate after a single 1 ml injection into a lateral lobe; note localized fluorescence. C) Two one ml vector injections, one on each side of the prostate showing typical punctate distribution. D) Four injections, two on each side of the prostate, with 0.5 mL each. Fluorescence was typically diffuse throughout the organ. The latter was the method chosen for subsequent clinical studies.

