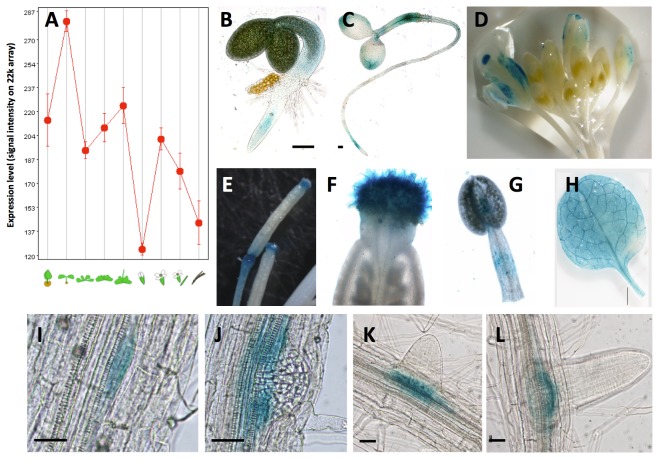
Figure 2. Expression analysis of SAUR76.
A) In silico expression analysis of SAUR76 using Genevestigator expressed as signal intensities on the 22k array. Expression of SAUR76 seen as GUS activity in promoter-reporter lines, in seedlings (B-C), flowers (D), stamens (E-F), filaments (G), leaves (H) and during several phases of lateral root development (I-L). Scale bar is 100 μm in B and C, 25 μm in I-L.

